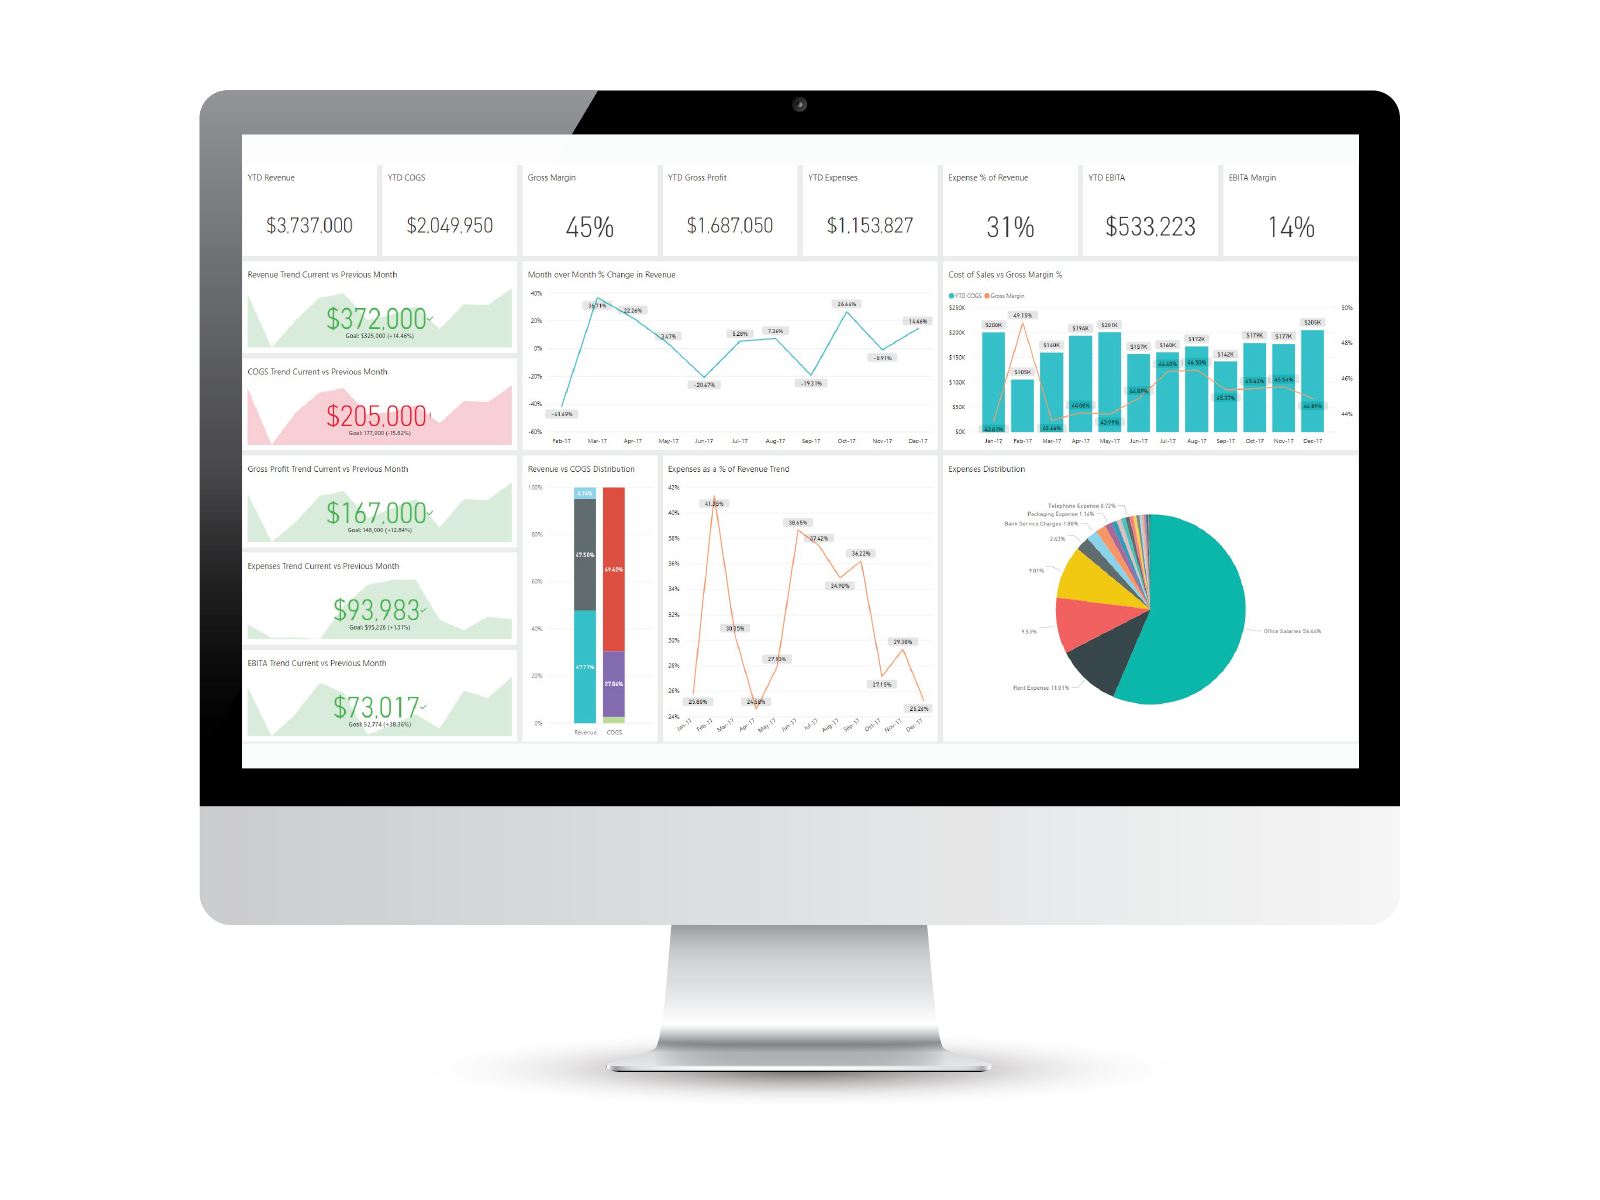
Data visualization expresses data and information with visuals to inform and enlighten your target audience. Used right, good visualization is an effective and efficient visual form of communication, presenting data in ways that engage your audience. Using Data Visualization effectively within your business will serve you with the confidence to make properly informed decisions. Vast amounts of data that would have previously been written up in lengthy reports, is instead succinctly presented in appealing and intuitive Visualizations. This not only saves time, but also increases engagement with the data among staff.
The speed of visual data
Thanks to computers and our ever developing technological abilities, we now have the power to process a previously unfathomable amount of data within a matter of seconds. Our migration onto the web and the increasing amount of content available to us, paired with less time to process it, has resulted in our attention being drawn to the messages which are most visually appealing. We now live in a visual world. Data Visualization provides the perfect opportunity to present easily digestible data chunks to our audience, instead of lengthy reports.
The effectiveness of Data Visualization
When connecting with your target audience, gone are the days of people reading and deciphering your message through text. People are relying more on efficient visual graphics to relay the same message, a perfect opportunity to use Visualization to your advantage and capture the attention of your audience.
Internally within your business, problems can be tackled and questions can be resolved quickly and more efficiently when the data is presented visually. It’s easier for your team to analyze and use to inform decisions, due to patterns and connections being formed in what would otherwise appear to be complicated and unconnected.
What does data visualization look like?
Visual data has to be more than just colorful and attention grabbing . First and foremost, it needs to be effective and functional. This is achieved by only displaying information that is relevant to the topic at hand and applicable to the message you want to communicate. Overwhelming your audience with too much data will result in your message being lost. Also, the best visuals can be easily updated with new data and information; this keeps your message fresh and relevant. As data changes, your visualization should change too.
Data visualization and storytelling
True when targeting your internal staff of customers, Data Visualization should be more than just visually appealing, the data should tell a story too. Stories aid in building a connection with your audience, which in turn build trust. Your data message should be at the forefront, but the story it is telling should keep your audience’s attention. The combination of a story and graphics is a potent combination for retaining people’s attention and aids recall in the future.
Strategic decision making with data visualization
Data Visualization gives your data meaning in a relevant and succinct way, summarizing the key data points applicable to the decision or idea being expressed. As well as telling a story and relaying a message, visualizations should answer questions–perhaps ones your audience didn’t know they had. This aids in faster strategic decisions due to the absence of clutter and a focus on what is really important.
Data visualization and market competitiveness
Due to the rise in data available to businesses and the increasing speed in which it needs to be analyzed and utilized to remain competitive, Data Visualization is here to stay. Between 2017 and 2022 the global Data Visualization market is expected to grow 9.21% to a market value of $6.99 billion USD. Businesses effectively using their data both internally and when targeting customers stand to gain big advantages over their competitors.


