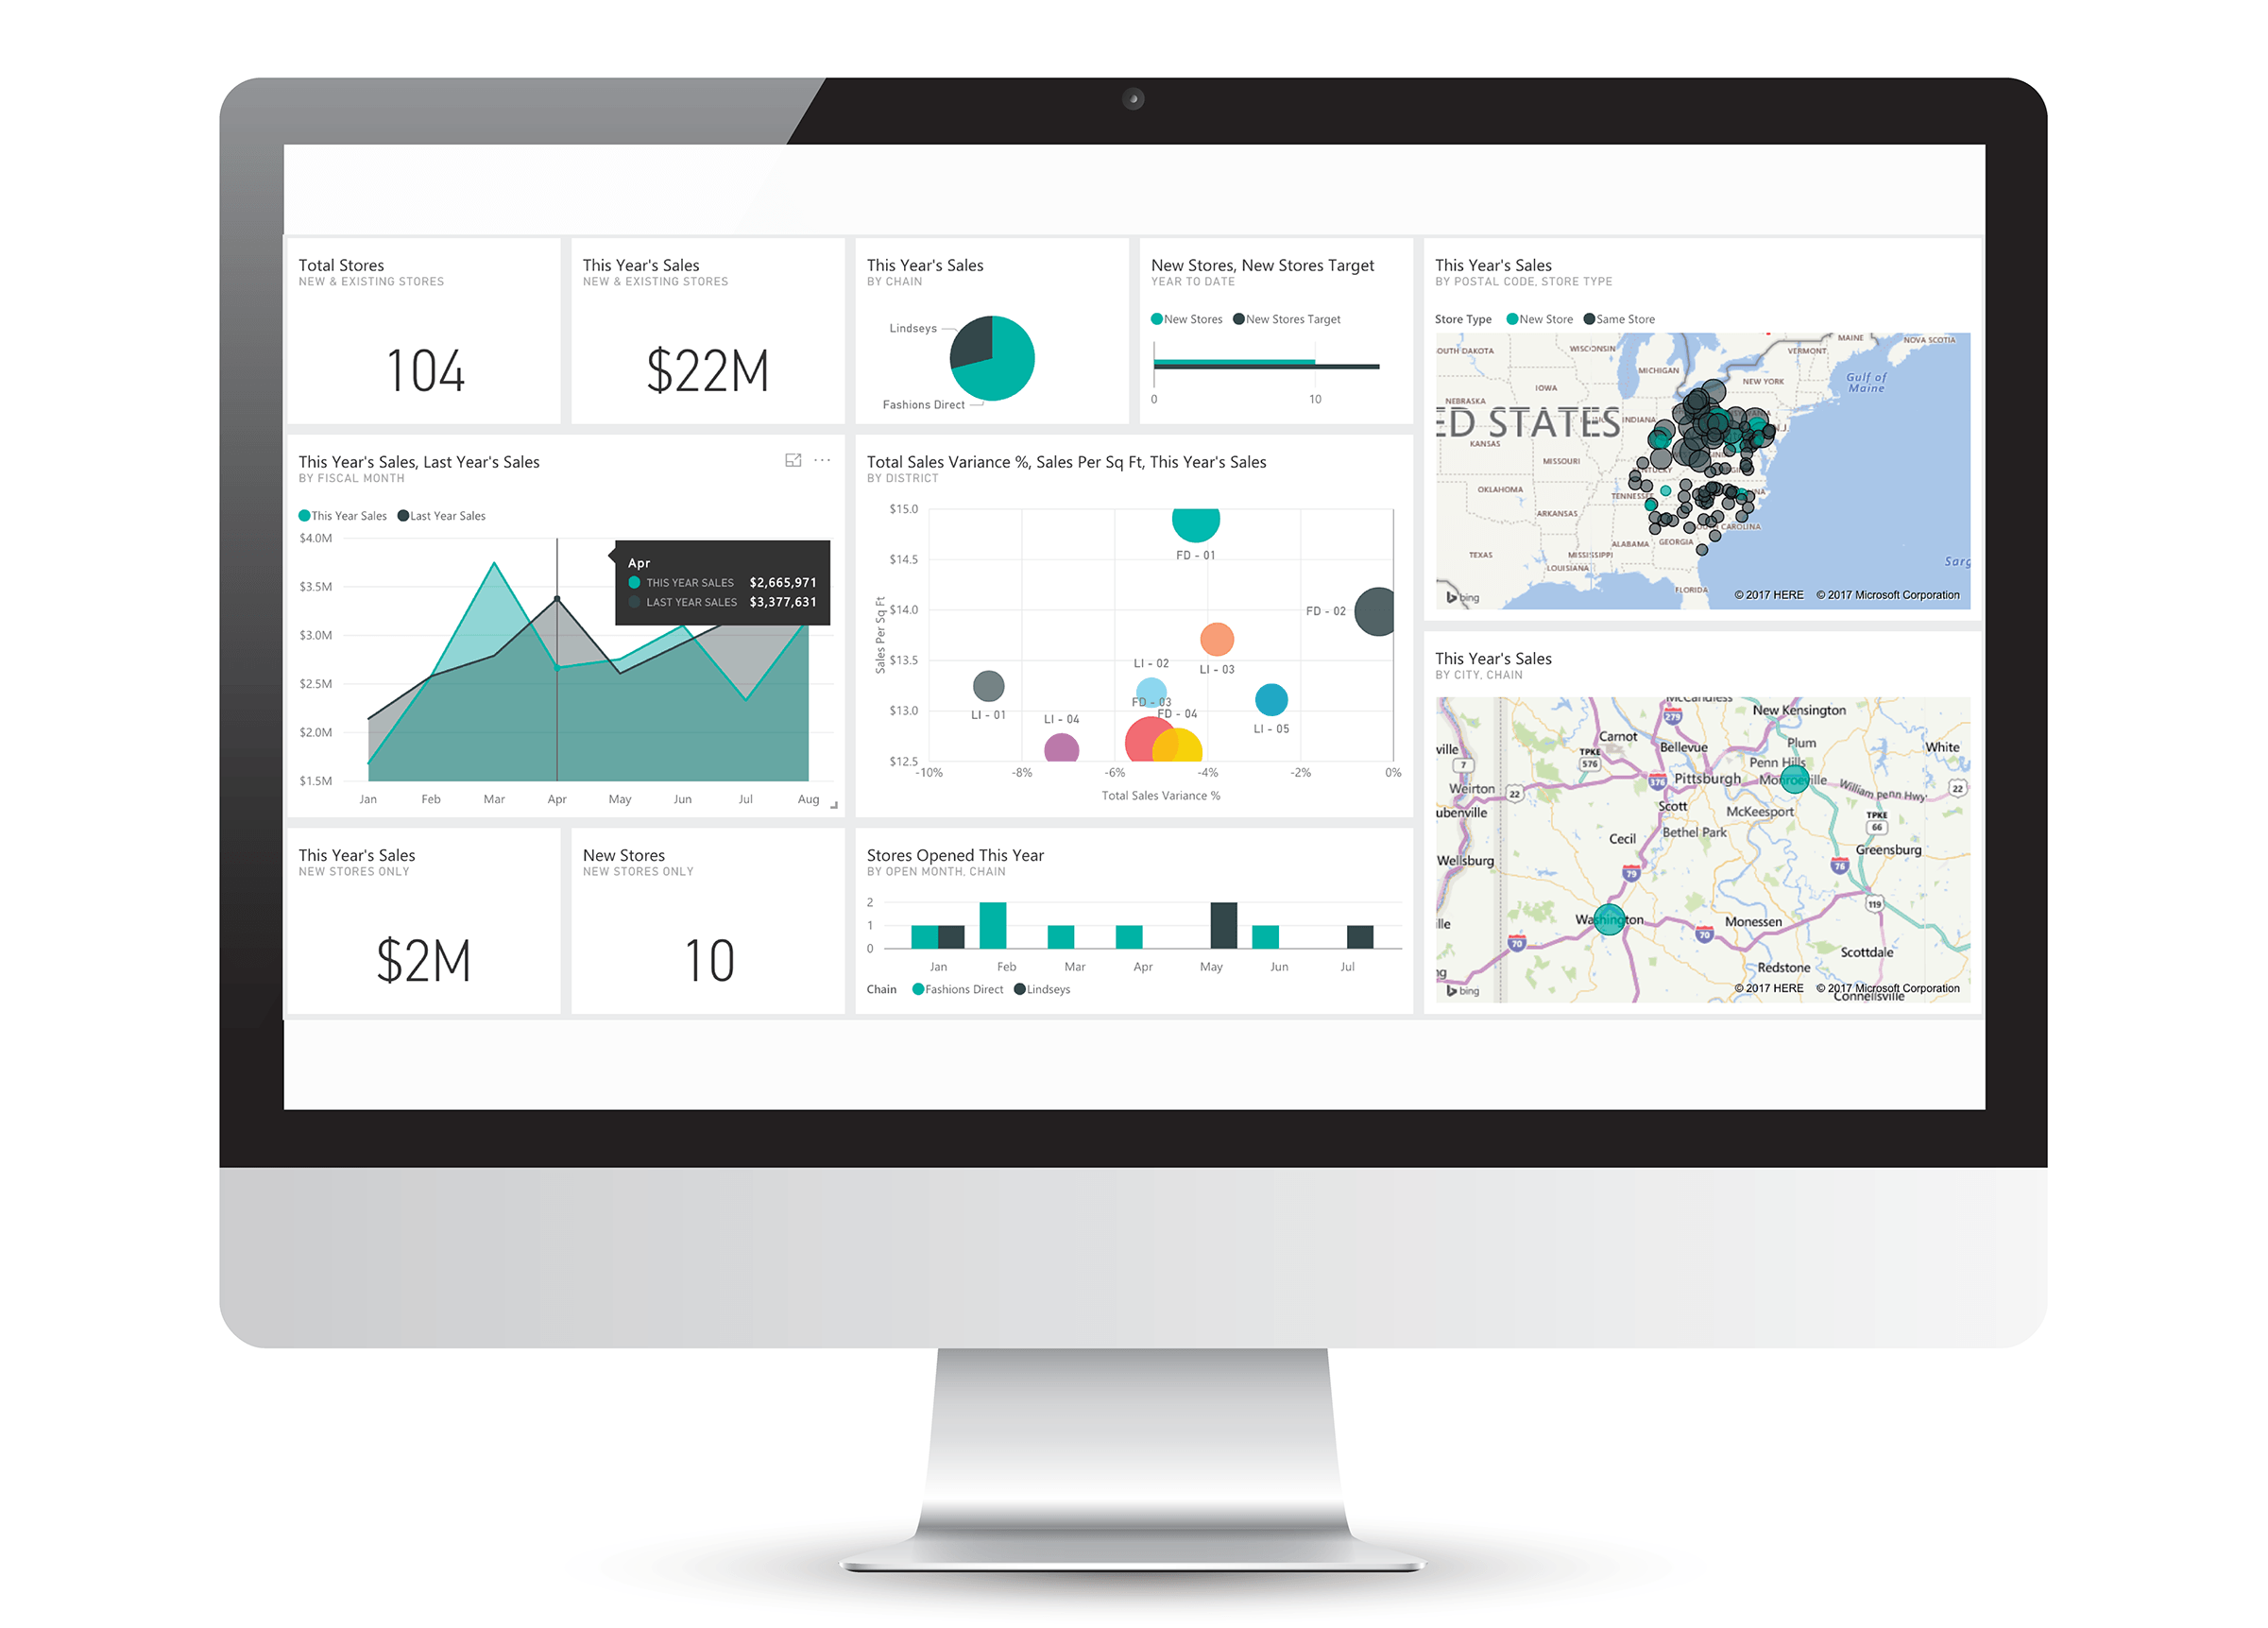
In-depth modern analytics, scalable reporting and dynamic data visualization.
We jumpstart your Power BI Reporting. Faster decisions with data. For your entire team.
Like Microsoft SQL, the systems that power your operation create incredibly valuable data — but it is frozen in silos. With Victor Strategy’s BI Integrations, we can help bring that data to life.
Take control of your company’s Microsoft SQL data, to see your business in new ways.
Streamline database business intelligence.
Follow your data’s relationships through each table.
Inform decisions by understanding hidden insights.
Remove barriers to detailed reporting.

Learn how to make your data USEFUL.
You have the data. Now what? Learn how to organize your data so it can be useable and insightful. Get our tips delivered straight to your inbox.